
Estimating the Costs for Future Filings
Published on 3 October 2016
Before the beginning of any year, it is critical for companies to estimate the costs for future filings, along with any subsequent filings that may happen through the Paris Convention and/or the Patent Cooperation Treaty. This process is not-so-straight forward and can become quite complicated for companies that have various business divisions, with each business division having its own subdivisions, as it would lead to multiple scenarios.
Let us consider the scenario of a 40-year old multinational company headquartered in San Francisco; this company has two different “Cost Centers”, namely “High Priority R&D” and “Low Priority R&D.” For example, the former may be the R&D work carried out in a “Center for Disruptive Technologies”, while the latter may be the R&D work carried out in a “Center for Incremental Innovations.”
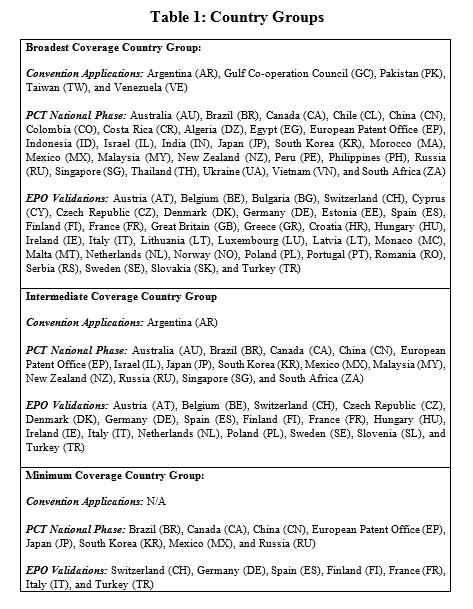
In addition, the company has company has three different “Country Groups”, namely “Broadest Coverage”, “Intermediate Coverage”, and “Minimum Coverage” (Table 1). These Country Groups have been carefully arrived at after numerous brainstorming sessions between the Patent Manager and the top management on the need to have different types of coverages for different types of situations. Thus, the Broadest Coverage group is applicable to strong patent applications disclosing high value inventions, while the Intermediate Coverage and the Minimum Coverage groups are applicable to inventions that have intermediate value and the least value relative to the Broadest Coverage group.
Therefore, six different Cost Center/Country Group combinations are possible, each with its own frequency of future filings (Table 2). It is assumed that the filings are spaced out evenly over the duration of the year i.e. one application is filed every two weeks (High Priority R&D/Broadest Coverage), every 24 days (High Priority R&D/Intermediate Coverage), and every six days (High Priority R&D/Minimum Coverage).
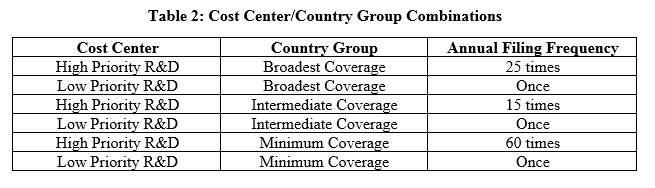
The above filing rates could be further refined by incorporating an abandonment rate. Let us assume a 10% abandonment rate at each stage i.e. Convention, PCT National Phase, and EPO validation. Thus, for every 10 priority applications, only nine applications make it through to the Convention stage (i.e. one application is abandoned), only eight applications make it through to the PCT National Phase stage (i.e. two applications are abandoned), and only seven applications make it through to the EPO validation stage (i.e. three applications are abandoned).
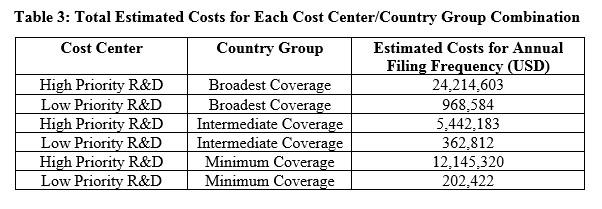
Table 3 contains the total estimated costs (official, associate, and translation) for each Cost Center/Country Group combination (including priority application costs). The costs range from $202,422 to $ 24,214,603. It is assumed that the priority application is electronically filed in the U.S. and consists of 40 pages (including 5 pages of drawings and 15 pages of claims) and 15 claims (including three independent claims). It is further assumed that a PCT application is filed with the U.S. as the International Searching Authority (PCT Chapter II not filed).
The estimated costs (official and associate) for filing one U.S. priority application is $2,960.
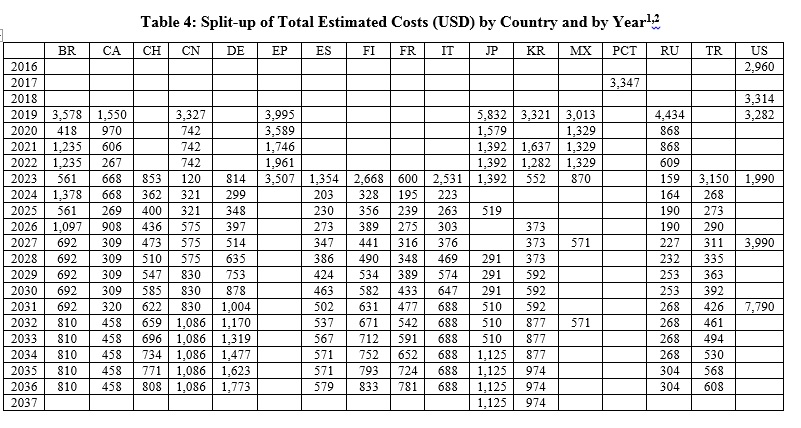
The total estimated costs can be split up by year and by country. The Low Priority R&D/Minimum Coverage combination has been used as an example to illustrate this split-up (Table 4). It is assumed that the first filing took place on August 11, 2016.
Such detailed estimation of costs for future filings before a year can facilitate budget planning and strategic decision making to a great extent.
The Strategy Planner is an easy-to-use tool from Quantify IP that accurately estimates the costs for multiple ‘what-if’’ scenarios in less than a minute, thus saving time and labor. The costs are estimated based on our meticulous research of patent legislations in 150+ jurisdictions. The “Strategy Analysis” feature, displays estimated costs by month (for the next two years), by quarter (for the next five years), or by year (for the next 20 years). In addition to displaying costs for each patent family by country by year, the tool also estimates costs by country by year, costs by family by year, costs for each country/stage (filing, examination, prosecution, grant, and maintenance) combination by year and costs for each country/category (official, associate, and translation) combination by year.
Want to know more? Contact us to learn more, schedule a demo, or request a free limited trial.
- Prosecution costs and grant year are based on our research of average number of office actions and ‘typical-time-to-grant’ respectively.
- For jurisdictions that follow a deferred system of examination, it is assumed that request for examination is filed at a later stage (separate associate costs involved) and not at the time of filing itself.
 for assistance.

