
The Art of War: Know Thy Competitors
Published on 25 August 2016
As Forbes writer Robert Langreth wrote in 2010, “Investing in a small or even medium sized biotech company is a lot like gambling in Las Vegas. You are either going to win big or lose big.” This is because of low success rates, which in turn escalate the cost of research and development. Drug candidates that make it to clinical testing have a ~ 90% failure rate. Estimates regarding the average cost per prescription drug approval vary between $2.6 billion1 and $5 billion2.
Patents provide a strong incentive for pharmaceutical companies to recoup their investment through market exclusivity and licensing. Additionally, several advanced jurisdictions, including the US, EU, and Japan have mechanisms to increase the effective term of a pharmaceutical patent to make up for delays that may be encountered during the regulatory process, thus providing an additional incentive.
The different stages of the patenting process (i.e. filing, examination, prosecution, grant, and maintenance/renewal/annuity) have costs (official, associate/attorney, and translation) associated with them. Accurate estimation of said costs, which is required to facilitate strategic decision making and budget forecasting can be a challenging and time consuming task, especially in the case of large patent portfolios involving tens of thousands of patents.
Our software, Company Portfolios Revealed (CPR), analyzes worldwide patent application data that has been obtained from the European Patent Office and projects costs for the next 20 years for any given patent portfolio.
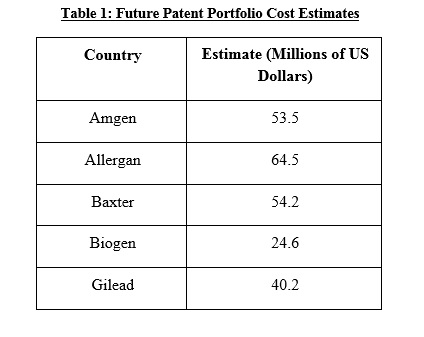
We used CPR to estimate the future patent portfolio costs of five mid-tier pharmaceutical firms: Allergan, Amgen, Baxter, Biogen, and Gilead (Table 1).
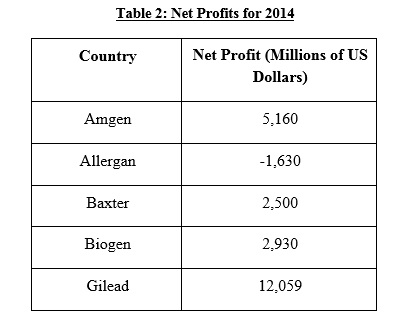
The data was then subsequently analyzed in relation to each company’s financial data (obtained from http://amigobulls.com/). The net profits for 2014 are depicted in Table 2 (negative number indicates loss). Of the five companies, Gilead was the most profitable in 2014. Allergan, which has the highest future cost estimate suffered a loss in 2014.
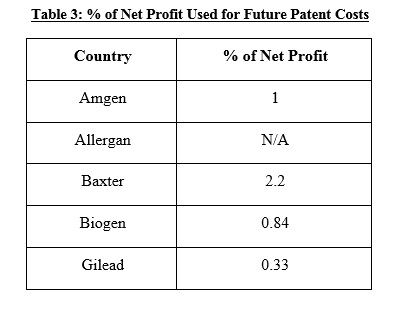
The percentage of net profit that would be used for future patent costs was used to normalize the data in relation to each company’s size; this index varied between 0.33% for Gilead and 2.2% for Baxter (Table 3).
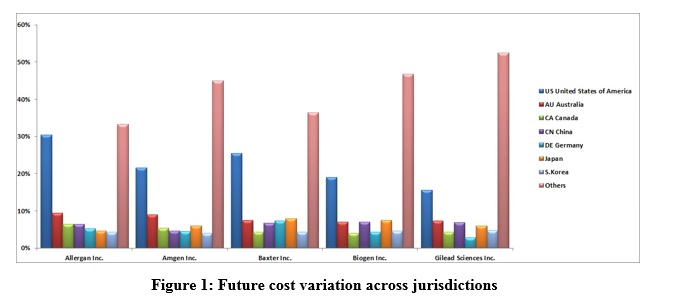
Finally, we also compared the future cost estimates across jurisdictions (Figure 1). While the United States jurisdiction constituted the highest proportion of future costs for all the companies, the percentage varied greatly from 15.5% (Gilead) to 30% (Allergan). The other major jurisdictions include Australia (6.9% for Biogen to 9.4% for Allergan), Canada (4% for Biogen to 6.4% for Allergan), China (4.6% for Amgen to 7% for Biogen), Germany (2.9% for Gilead to 7.3% for Baxter), and Japan (4.7% for Allergan to 7.9% for Baxter).
Company Portfolios Revealed (CPR) is a proprietary, patent-pending tool that provides exceptional insights into the patent portfolio of any company. It caters to the requirement of a diversity of audiences, including R & D managers, investors, and acquisition analysts. Specifically, it is a perfect partner for competitive analysis investigations. The tool generates a wide variety of advanced and meticulously formulated reports, including Filing Pattern Analysis, Detailed Cost Analysis, Ungranted Aging, Expiring Patents and Time-to-Grant.
Interested in getting such reports for your company or your competitors? Email us at qipcontact@quantifyip.com or call us at +1-808-891-0099.
Notes:
- Tufts Center for the Study of Drug Development, Briefing: Cost of Developing a New Drug, November 18, 2014
- Matthew Herper, The Cost of Creating a New Drug Now $5 Billion, Pushing Big Pharma to Change, August 11, 2013
 for assistance.

